Prerequisite:- 1. Installed MySQL Enterprise Monitor(MEM). 2. Putty - https://www.putty.org/ 3. Up & Running MySQL Heatwave Service on Oracle Cloud Infrastructure (OCI). 4. Up and Running Compute instance in OCI. Note:- To download MySQL Enterprise Monitor trail version by below links:- https://edelivery.oracle.com/ Note:- download only service manager , AGENT is not required for MySQL Heatwave Service |
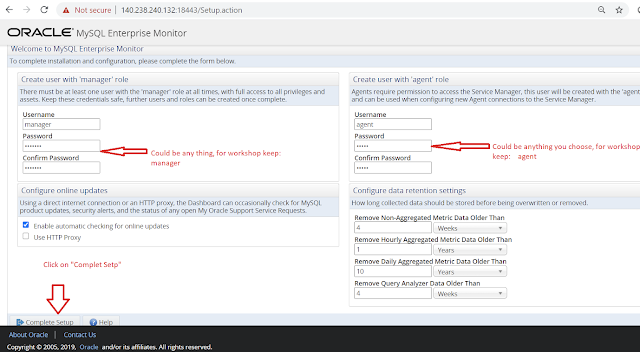
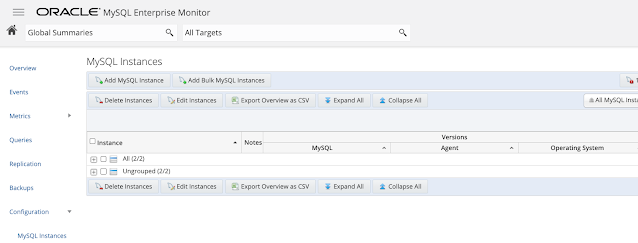
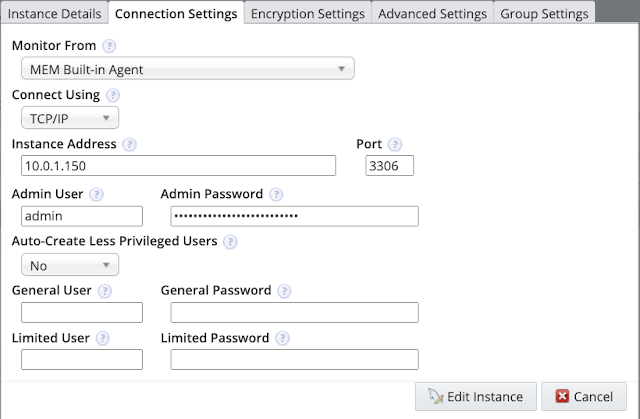
How to Install MySQL Enterprise Monitor?Below steps is to be followed (assuming installation host is Linux- OL/RHEL/CentOS) Installation of Service Manager on Compute Instance of OCIStep 1:-goto location of downloaded location of service manager & Give the persmission #cd /home/opc/bootcamp/Monitor/ #chmod +x mysqlmonitor-8.0.31.1413-linux-x86_64-installer.bin Step 2:- Execute the file #./mysqlmonitor-8.0.31.1413-linux-x86_64-installer.bin Step 3:- Follow the instructions prompted on screen, always keep default value so keep pressing ENTER Please keep all password as example like this:- MySQL8.0 # one Caps , Number ,Special Character ,Letters, 8 long Step 4:- To Check Service Running or not:- #service mysql-monitor-server status #####In case any error occurred below while installation , please execute below to fix it Error: error while loading shared libraries: libtinfo.so.5: cannot open shared object file: No such file Fix: #sudo yum install ncurses-compat-libs Step 5 : Login to MySQL Enterprise Monitor(MEM) To Login Web Browser , assume google chrome running on your local machinemake sure IP address is whitelisted to access from your local machine. https://129.154.228.159:18443/ #<use your public IP address> Create User “Manager” Role:- manager/manager Create User “Agent” Role:- agent/agent Open MySQL Enterprise Monitor(MEM)Go to Configuration >>MySQL Instances >> Add MySQL Instance
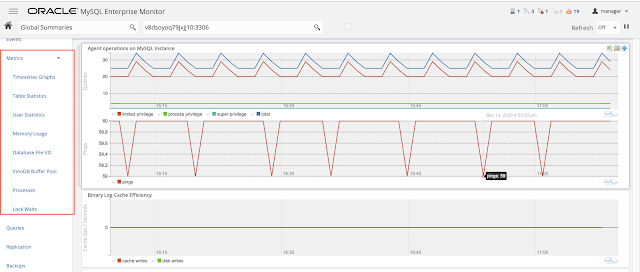
Enter above details as below. Once connection to heatwave service established then below output look like. Visual Query Analysis Monitor real-time query performance, check execution statistics, filter and pinpoint SQL code that is causing a slow-down. Using the Performance Schema with MySQL Server 5.6, data is gather Find and Fix Expensive Queries Correlated graphs enable developers and DBAs to compare execution parameters, such as the server load, thread statistics, or RAM usage against the queries that were executing at that time. Simply highlight a time slice on a graph to find the most expensive queries and locate a potential cause for the larger performance issue. To review the list of queries running from MySQL Heatwave Service , click on "Query" tab to review itand click on each individual queries to get deep insight about what's going on with the queries.some of screenshot as below ConclusionMySQL Enterprise Monitor provides real-time visibility into the performance and availability of all your MySQL databases including hybrid environment (OnP and Cloud) and Start monitoring MySQL within 10 minutes with zero configuration and no agents. MySQL Heatwave Database Service is a fully managed database service that enables organizations to deploy cloud-native applications using the world's most popular open source database. It is 100% developed, managed and supported by the MySQL Team. You will get one database for OLTP ,OLAP,ML,Lakehouse which is very unique solutions available in multi-cloud environment(OCI ,AWS,Azure). |


